

Salesforce OmniStudio provides powerful tools like OmniScripts and FlexCards to automate processes, guide users, and present data in a user-friendly manner. However, as these components grow in complexity, debugging becomes essential to ensure smooth operation. The OmniStudio Network Logger is a key tool that allows administrators and developers to monitor real-time requests, responses, and errors, helping them quickly identify and resolve issues.
Using the Network Logger reduces downtime, improves accuracy, and enhances the end-user experience. This is particularly critical in large Salesforce orgs where multiple OmniScripts, FlexCards, and DataRaptors interact with one another.
What is the OmniStudio Network Logger?
The OmniStudio Network Logger is a browser-based debugging tool that tracks and inspects every network call made by OmniScripts and FlexCards.
It lets you see exactly what’s happening behind the scenes — including requests, responses, errors, execution times, and payloads — all in one place.
Add this extension-
Think of it as Chrome DevTools, but built specifically for OmniStudio developers.
Why Use Network Logger?
- Real-Time Monitoring:
- Capture and view HTTP requests and responses instantly.
- Identify where an error occurred during an OmniScript execution.
- Capture and view HTTP requests and responses instantly.
- Enhanced Debugging:
- Trace component interactions with external APIs and Salesforce back-end processes.
- Quickly pinpoint the root cause of failures in FlexCards or OmniScripts.
- Trace component interactions with external APIs and Salesforce back-end processes.
- Error Reduction:
- Helps prevent data inconsistencies by detecting misconfigured actions or integrations.
- Helps prevent data inconsistencies by detecting misconfigured actions or integrations.
- Better Development Workflow:
- Provides detailed logs for developers, enabling faster testing and deployment.
- Provides detailed logs for developers, enabling faster testing and deployment.
Step-by-Step Guide to Debugging with Network Logger
Step 1: Enable the Network Logger
- Navigate to Setup → OmniStudio → Network Logger.
- Activate the logger for your org or sandbox environment.
Step 2: Access the Component to Debug
- Open the OmniScript or FlexCard you want to monitor.
- Trigger actions that are causing issues (e.g., submitting a form, fetching data).
Step 3: Capture Logs
- Network Logger will capture all network requests made during the component execution.
- Review requests and responses for any failed or incorrect actions.
Step 4: Analyze the Logs
- Check HTTP status codes to identify errors (e.g., 400, 500).
- Inspect payloads to ensure data is sent correctly.
- Look at response messages to understand failures.
Step 5: Correct Issues
- Adjust OmniScript steps, FlexCard configurations, or DataRaptor settings based on the logged errors.
- Retest the component after changes.
Step 6: Document and Share
- Keep a log of fixes applied and lessons learned.
- Share with team members to avoid repeating errors.
Best Practices for Using Network Logger
- Test in Sandbox First:
- Always debug in a sandbox environment before making changes in production.
- Always debug in a sandbox environment before making changes in production.
- Filter Logs:
- Use filters to focus on specific OmniScripts, FlexCards, or DataRaptors.
- Use filters to focus on specific OmniScripts, FlexCards, or DataRaptors.
- Track Dependencies:
- Be aware of how the component interacts with others to prevent cascading errors.
- Be aware of how the component interacts with others to prevent cascading errors.
- Combine Tools:
- Use Salesforce debug logs alongside Network Logger for a comprehensive view.
- Use Salesforce debug logs alongside Network Logger for a comprehensive view.
- Keep Logs Clean:
- Clear old logs regularly to prevent clutter and ensure performance.
- Clear old logs regularly to prevent clutter and ensure performance.
Common Issues and Troubleshooting
- Missing Data in Logs: Check that Network Logger is enabled for the correct environment and components.
- Confusing Payloads: Use JSON viewers or formatters to read large payloads easily.
- Performance Lags: For orgs with heavy traffic, filter requests to avoid being overwhelmed by logs.
⚙️ How to Debug an OmniScript or FlexCard
Let’s say you have an OmniScript form on your site that creates an Account record using a DataRaptor Load.
When you click Save, the DataRaptor executes and creates the record in Salesforce.
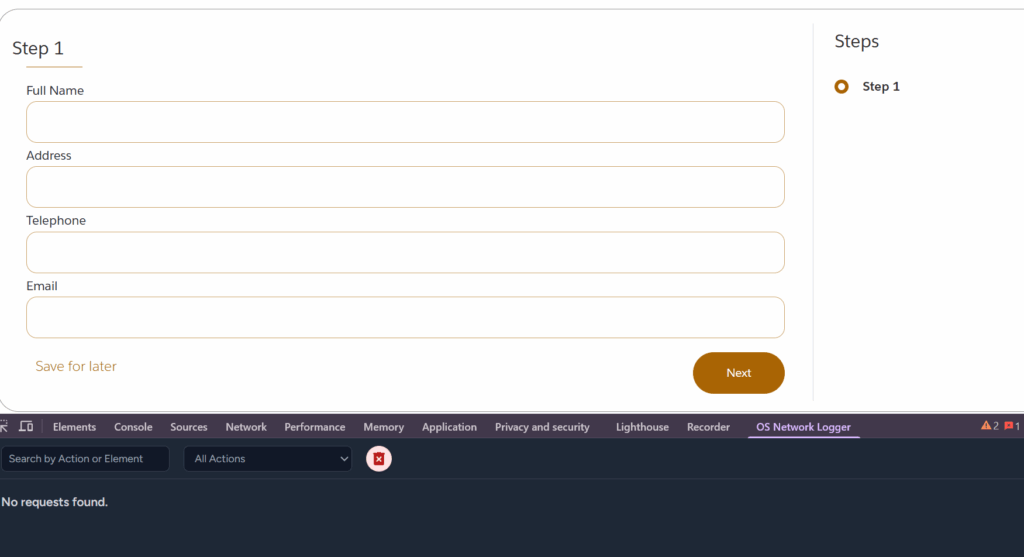
As soon as you act on your OmniScript — such as clicking Next or invoking a DataRaptor — the Network Logger starts capturing all the related network calls.
To access it:
- Open the browser’s Inspect panel
- Press Ctrl + Shift + I (Windows) or Cmd + Option + I (Mac).
2. Go to the OmniStudio → Network Logger tab.
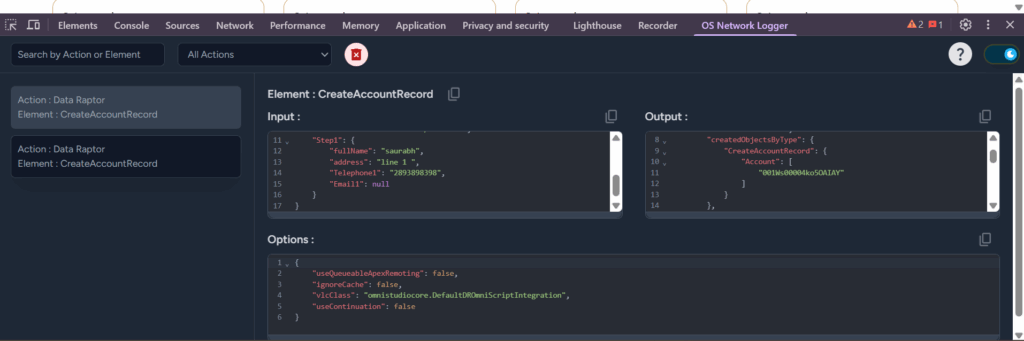
From there, you can monitor everything happening in real time — which actions are triggered on each click or page load, what data is being passed in the request, and what response is coming back from Salesforce.
Why It’s Useful
Using the Network Logger, you can easily:
- Verify if your DataRaptors, Integration Procedures, or API calls are running correctly.
- Check request and response payloads.
- Identify errors or invalid fields.
- Measure execution time and detect performance issues.
Practical Example / Use Case
Imagine a customer onboarding OmniScript that integrates with multiple DataRaptors and FlexCards to fetch account, contact, and subscription details.
- A user reports that subscription data is not displaying correctly.
- Using Network Logger, the developer monitors the requests made by the OmniScript.
- The logger shows a failed API request due to a missing field in the DataRaptor.
- The developer corrects the DataRaptor mapping, retests, and confirms the OmniScript works as expected.
Without Network Logger, identifying the root cause would have required hours of trial and error.
Conclusion
Salesforce OmniStudio Network Logger is an essential tool for debugging OmniScripts and FlexCards. By capturing real-time network activity, it allows administrators and developers to pinpoint issues quickly, ensuring smooth operation and improving the user experience. Following best practices such as testing in a sandbox, filtering logs, and documenting changes will maximize efficiency and reduce errors in complex Salesforce environments.